Pollen Project Mapping
Here I am outlining the visualizations to illustrate potential site selection for the pollen project. I’ll start with a brief introduction into the sites of interest:
For this first run through I focused on looking at how sampling has occurred over each of the ecoregions, what diversity of bees is present, what peaks of sampling exist through time, and what the taxonomic scope we can expect out the collections. Here is a seperate page describing a bit more in detail how these metrics and plots were made.
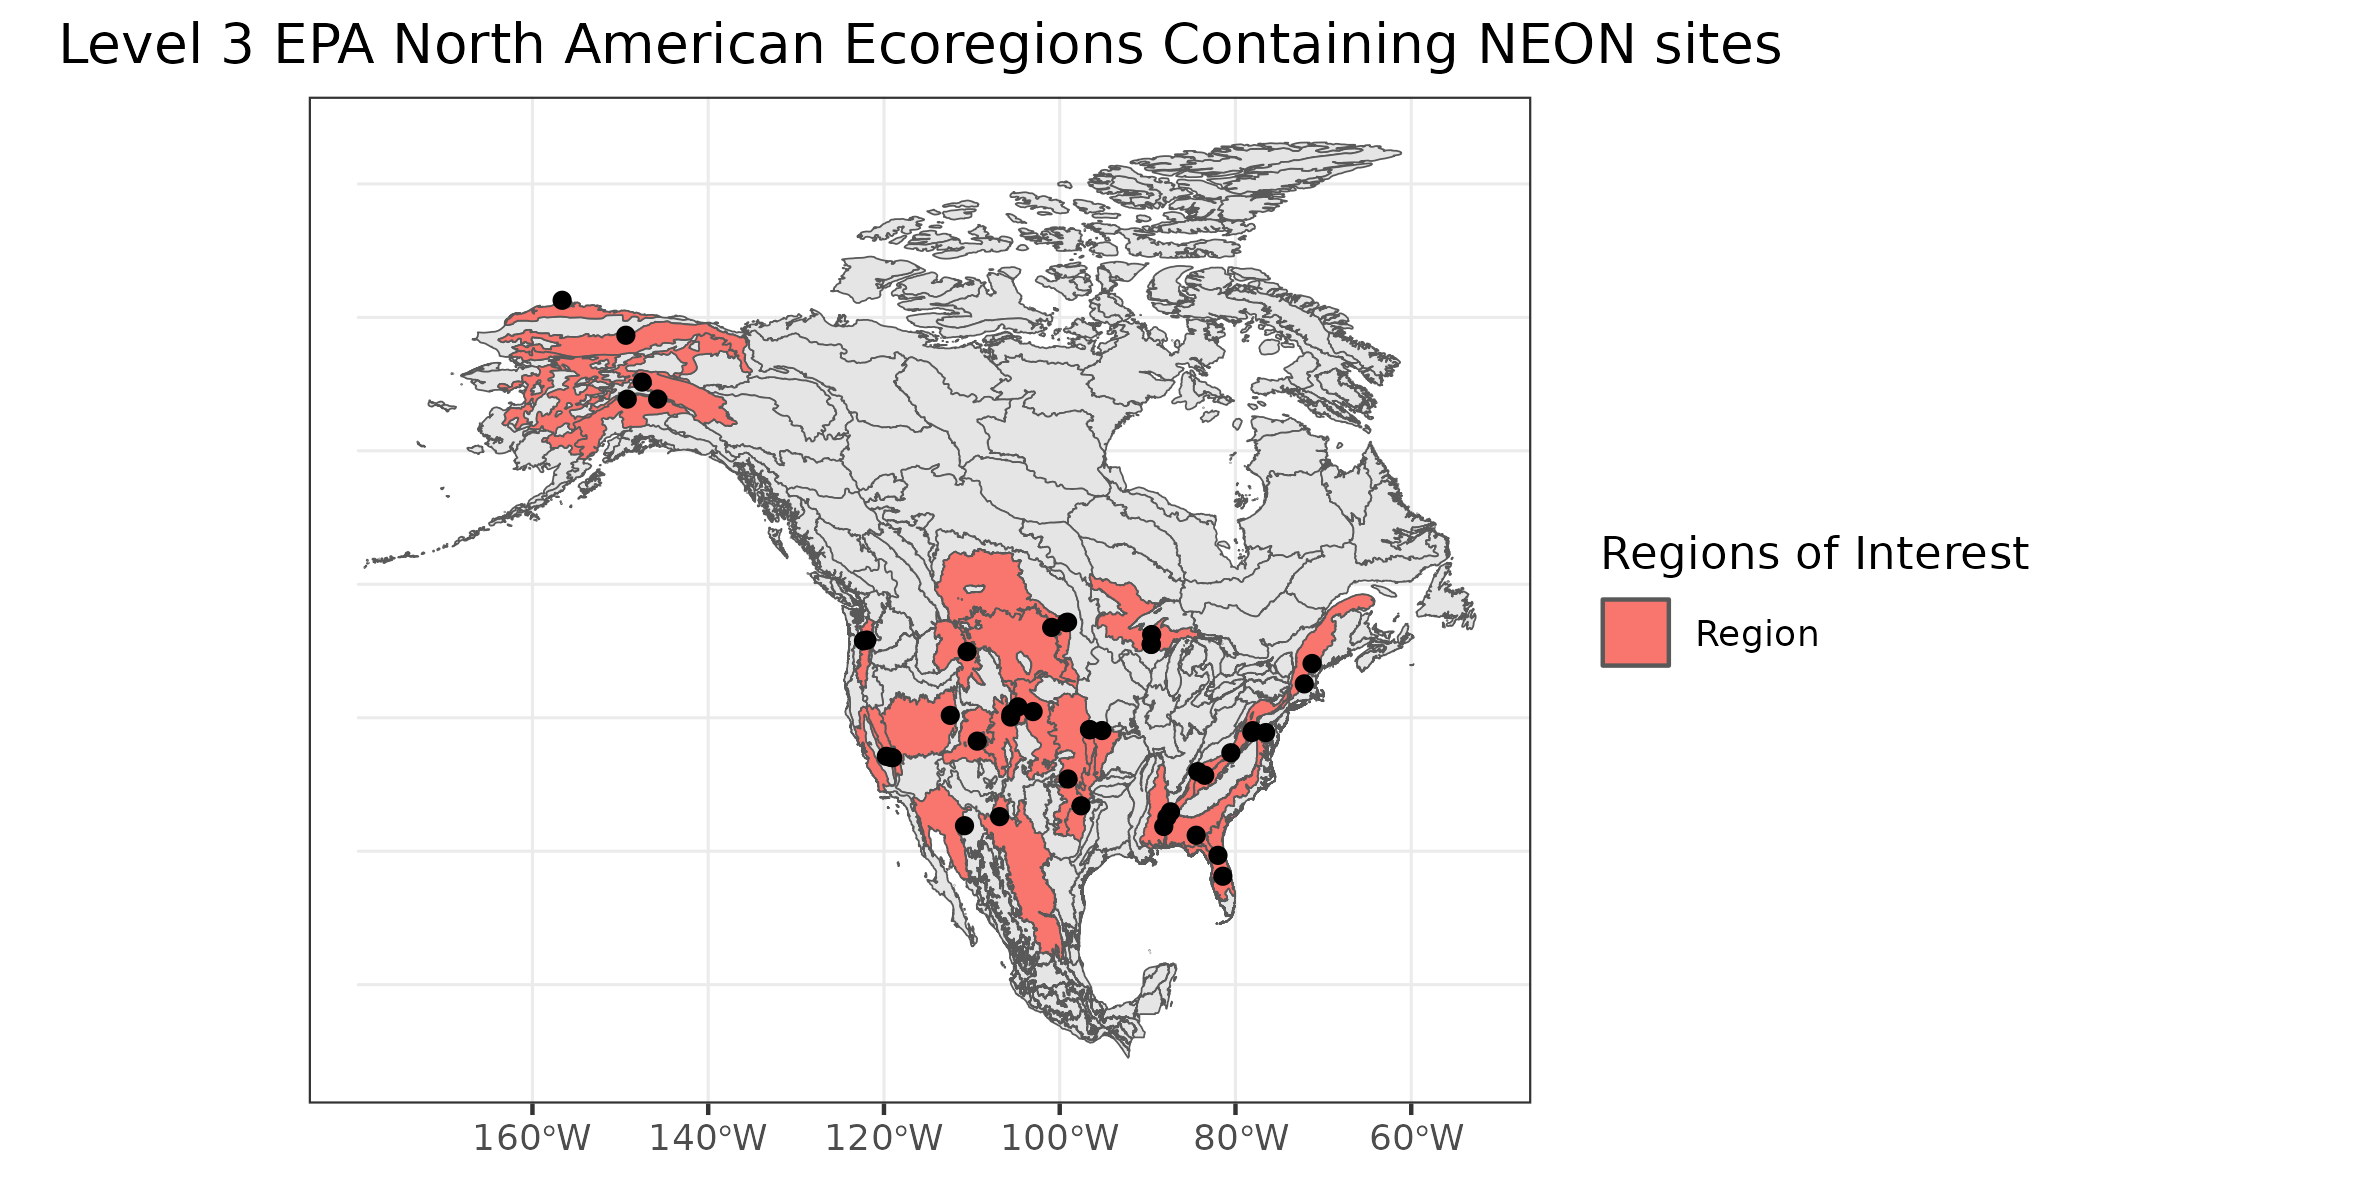
This figure represents the the level 3 North American ecoregions containing NEON sites. There are a total of 27 unique ecoregions containing the 44 NEON terrestrial sites that applies to the continental extent of North America.
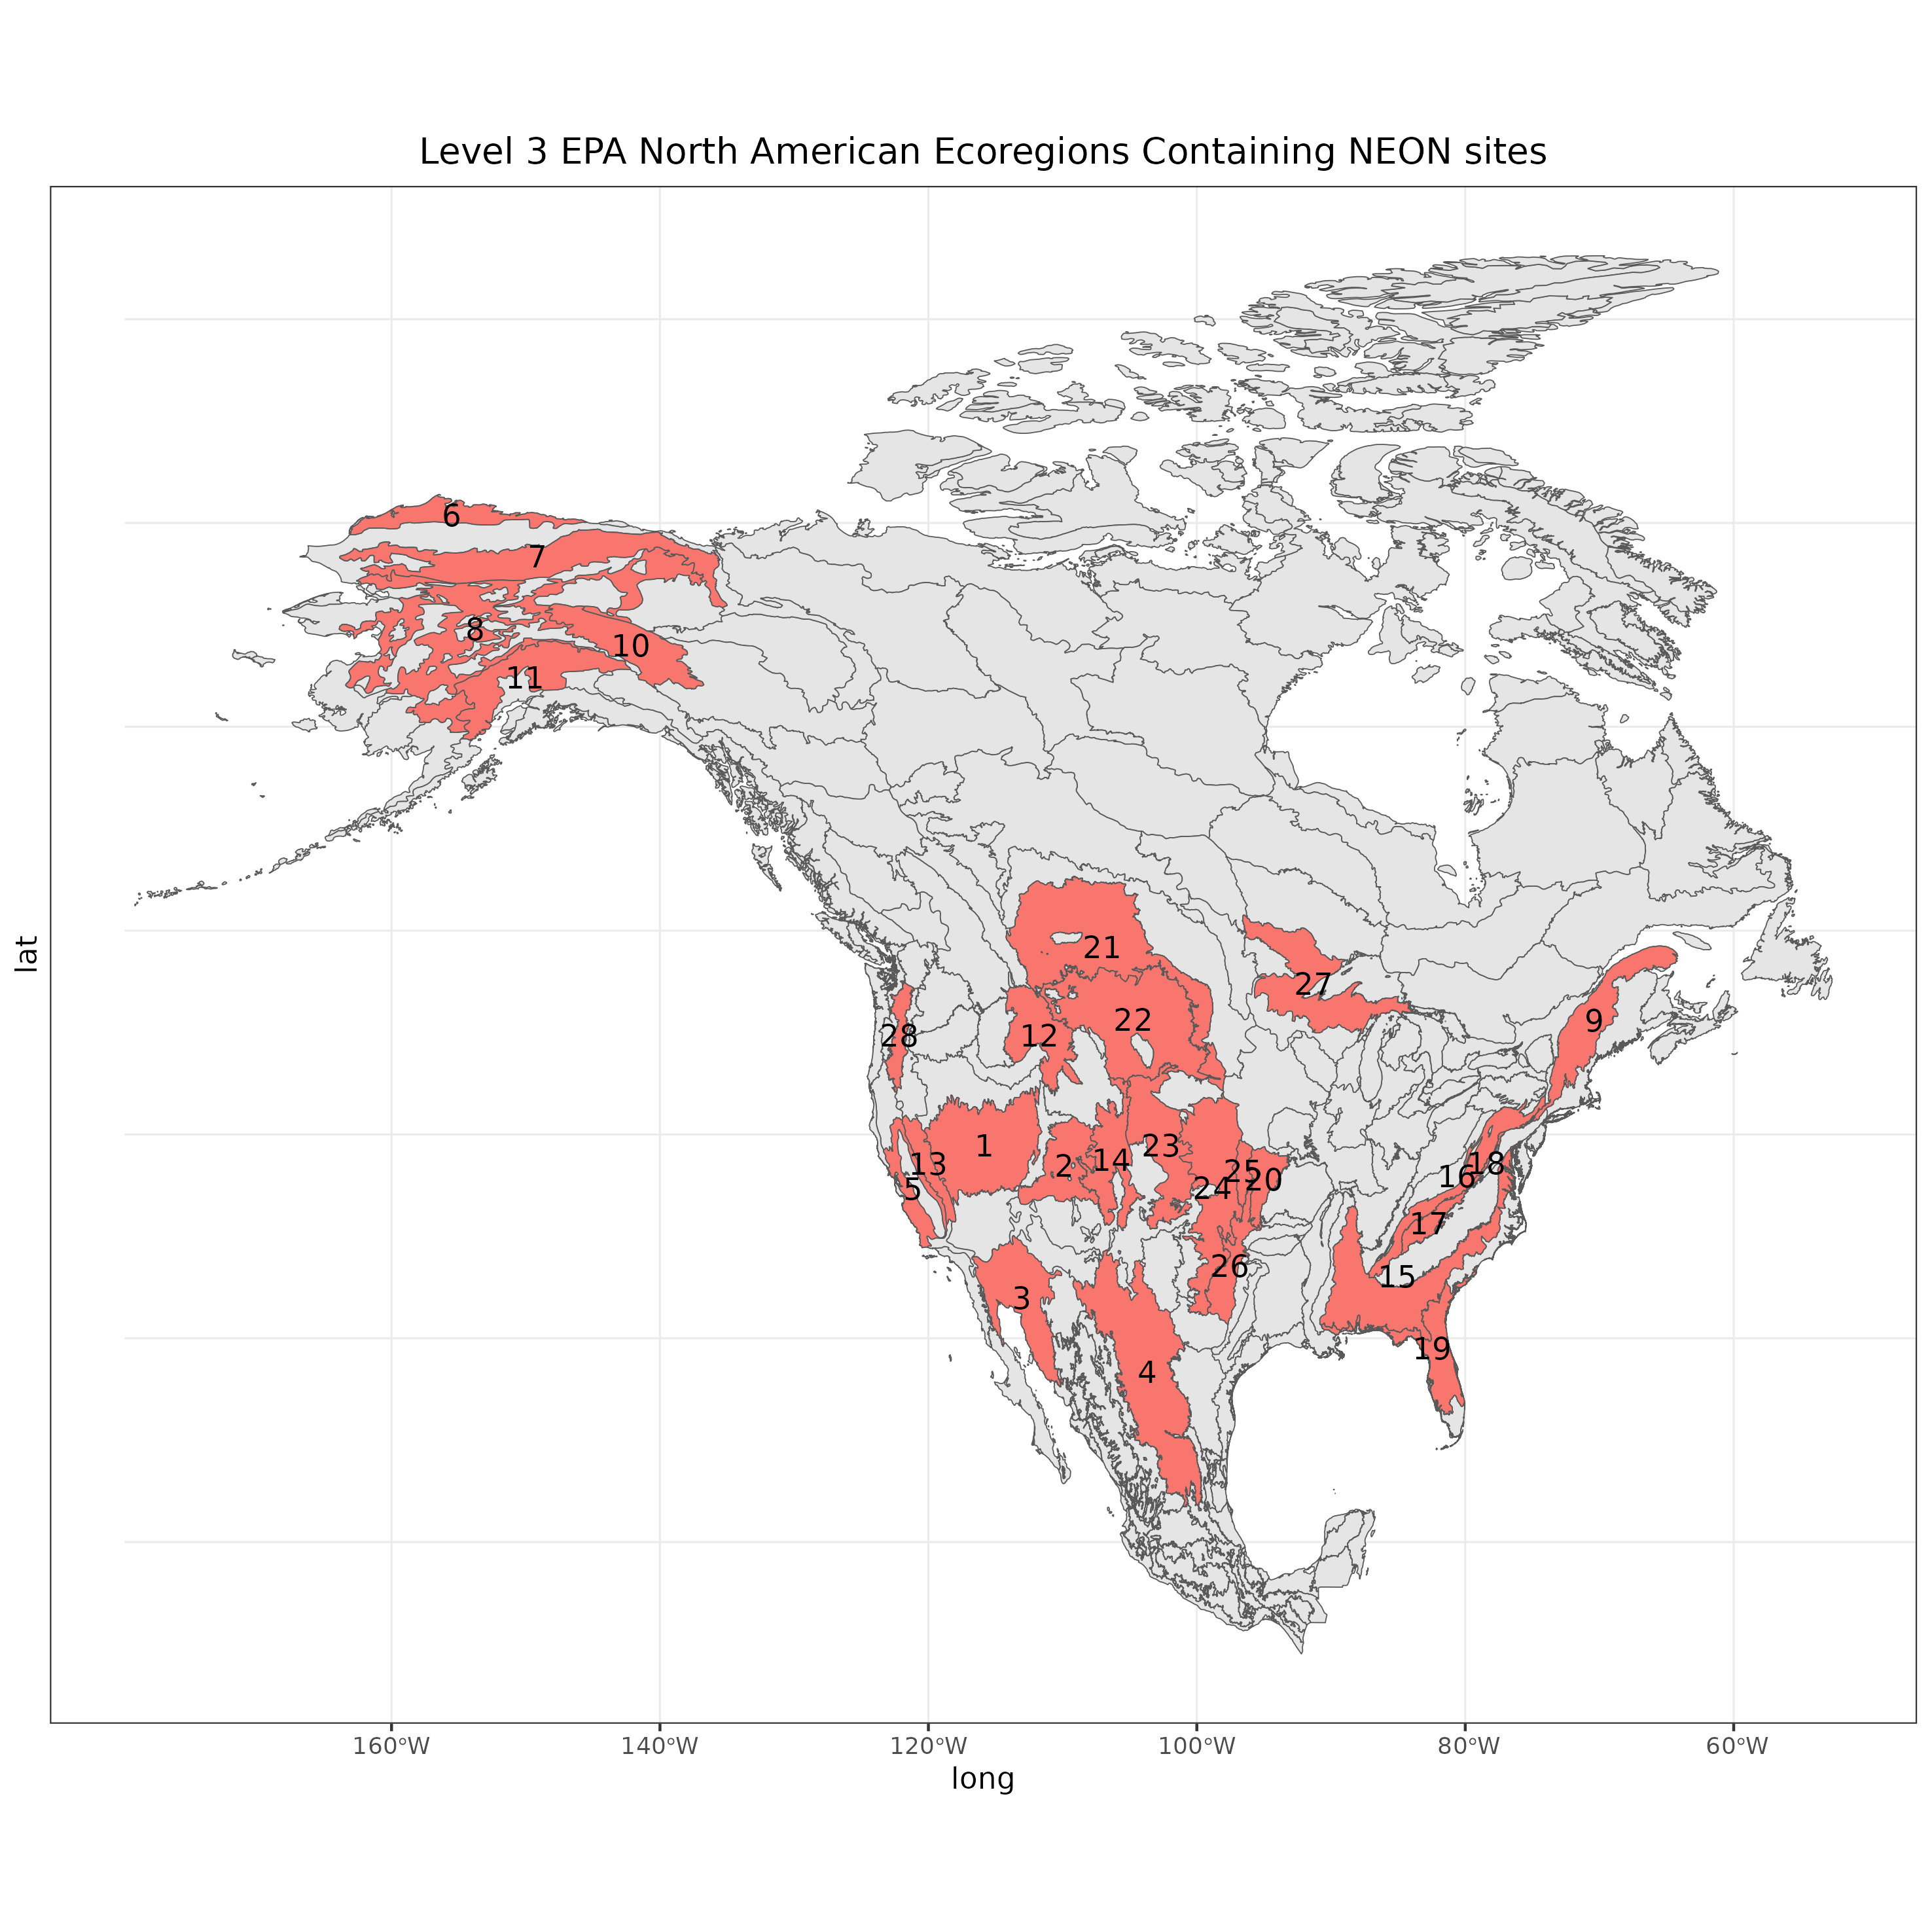 In a bit more detail, here are the ecoregions labeled with IDs. Written below is the key to these ids, as well as a hyper link to each page. Note that Blue Ridge shows up twice, giving us a grand total of 28. * denotes plant metrics are included in this ecoregion page.
- Central Basin and Range*
- Colorado Plateaus
- Sonoran Desert*
- Chihuahuan Desert
- California Coastal Sage, Chaparral, and Oak Woodlands*
- Arctic Coastal Plain*
- Brooks Range/Richardson Mountains*
- Interior Forested Lowlands and Uplands*
- Northern Appalachian and Atlantic Maritime Highlands
- Interior Highlands and Klondike Plateau*
- Alaska Range*
- Middle Rockies
- Sierra Nevada*
- Southern Rockies
- Southeastern Plains
- Ridge and Valley
- Blue Ridge
- Blue Ridge
- Southern Coastal Plain*
- Central Irregular Plains
- Northwestern Glaciated Plains
- Northwestern Great Plains
- High Plains
- Central Great Plains
- Flint Hills
- Cross Timbers
- Northern Lakes and Forests
- Cascades
Ecoregion description intros were summarized from information published by the EPA that can be found here Citation: Wiken, Ed, Francisco Jiménez Nava, and Glenn Griffith. 2011. North American Terrestrial Ecoregions—Level III. Commission for Environmental Cooperation, Montreal, Canada